

 9.10.2024
Optimising inventory management with system dynamics
Predicting the dynamic behaviour of order flows and efficiently planning inventory management are key challenges for the manufacturing industry. However, there is a solution that helps balance the need to avoid excessive capital tied up in inventory while maintaining good delivery capabilities, thereby supporting business growth and operational development.
Finding balance in inventory management is a challenge for many manufacturing companies. Simplified, the problem boils down to two extremes: a fully stocked inventory allows for quick deliveries and improves customer satisfaction, but excessive capital tied up in inventory poses a significant risk.
While designing balanced and market-based inventory management is demanding, it can be achieved using tools based on system dynamics. STE Analytics has solid experience in industrial and inventory management and specialises in analysing cyclical markets. This differentiates us from our competitors and helps our clients avoid short-sighted solutions.
Demand forecasts at the core of everything
Let’s take an example from the engineering industry. A company manufactures large and expensive equipment critical to its customers’ operations. Naturally, spare parts and maintenance services are also offered for these products, and the spare parts for the main product are quite valuable. If a critical piece of equipment breaks down and no spare part is available, the customer’s production stops, leading to significant revenue loss.
The spare parts supply chain is long, so accurately forecasting demand and placing orders with subcontractors must be done proactively. This situation is complicated by potential downturns in the industry, where companies look for cost-saving measures—often by releasing capital tied up in inventory.
The risk is that a substantial amount of capital could be tied up in spare parts inventory for a long time. The management’s challenge is to find a balance so that inventory is not optimised based on incorrect conclusions, which could cause problems when the market recovers.
Rationally minimising inventory value starts with creating accurate demand forecasts. This requires a deep understanding of what constitutes order flows and the factors influencing them under different market conditions. In other words, it is essential to grasp the overall market structure and dynamics.
Leverage points and order flow control
Systems thinking and system dynamics provide companies with the opportunity to identify the most critical leverage points in their order processes. Using this approach, companies can predict how various internal and external factors will impact their business. This, in turn, enables the management to make better-informed strategic decisions related to capacity planning, resource allocation, and market expansion.
Customer capital project orders can be divided into four categories: new investments, investments for maintaining existing equipment, investments due to project expansions, and equipment renewals. These categories are closely interconnected.
By analysing order flow dynamics, a company can gain deeper insight into the structures and drivers behind order flows in its industry. This understanding enables more accurate demand forecasts, leading to optimised inventory levels and more efficient production schedules.
Better understanding of order flow dynamics also helps identify inefficiencies and bottlenecks in the company’s operational processes. Addressing these issues allows the company to streamline its operations, resulting in shorter delivery times, lower operational costs, and improved customer service.
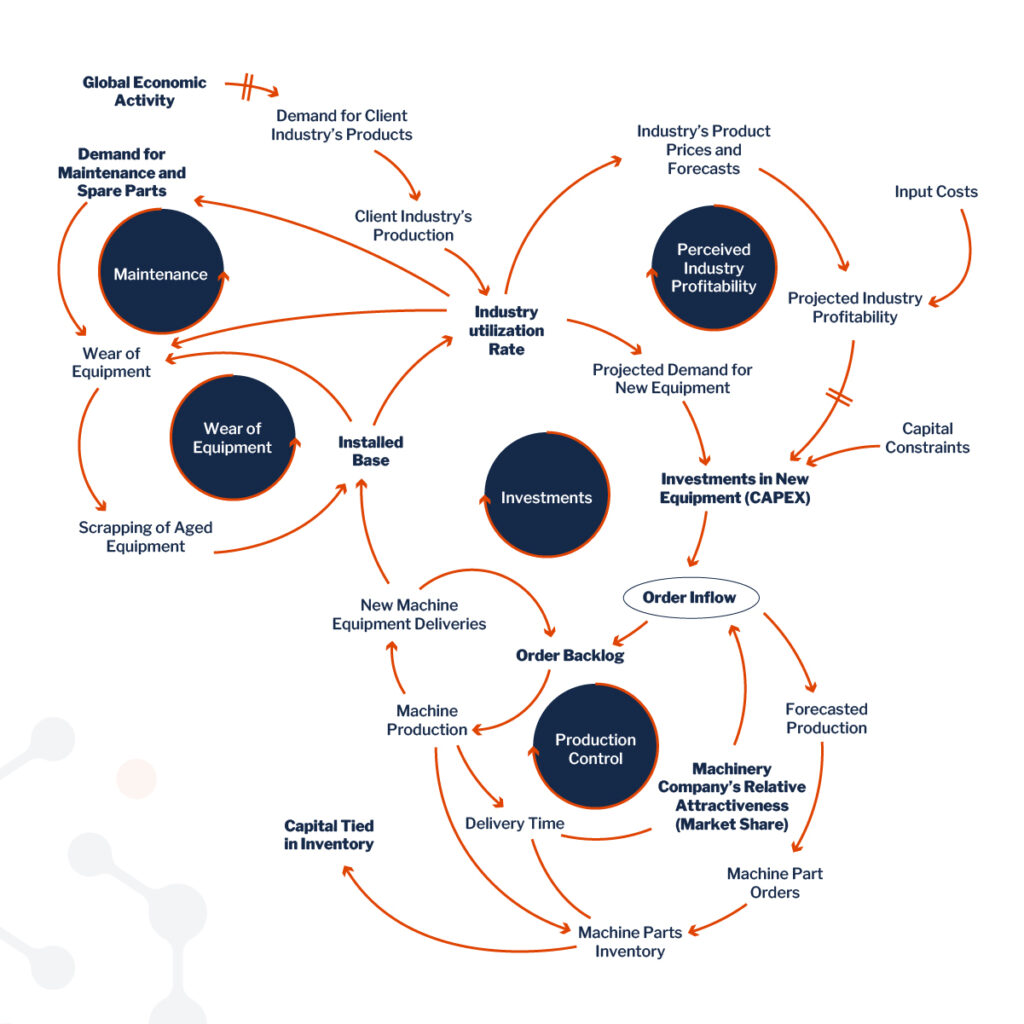
Benefits of a structural causal map
We use a structural causal map to plan inventory management and anticipate order flows, serving the goals in various ways:
- A visual representation of all system components and their interdependencies facilitates understanding of the complex network of cause-and-effect relationships in the market.
- The map helps to understand the market structure that generates observable dynamic phenomena, such as price fluctuations or demand volatility.
- Developing strategies and action plans becomes possible when the points of intervention are clearly visible, showing where intervention would be most effective and how it can lead to the desired outcomes.
- Unintended consequences of decisions can be anticipated, such as how aggressively pursuing long-term contracts might inadvertently reduce market flexibility.
